
Use the Service quality report to understand how conversations are resolved, whether response-time commitments are being met, and where AI agents, teammates, teams, or channels need attention.
Open it from the Service quality report card under Operations & Experience on the Dashboard.
How this report counts results
AI resolution, team resolution, and unresolved rates group service interactions by when each interaction started. A reopened conversation can have a later interaction with a different start date. SLA compliance uses the start of each response obligation; customer satisfaction uses the survey answer date. In the performance table, each column uses its relevant handling, response, or resolution dates.
For example: Service interaction started April 7 → Resolved April 10 → Counted on April 7 in the resolution rates.
Recent values can change when an interaction resolves, an SLA obligation is answered or breaches, or a survey answer arrives. Compare older periods when you need more stable results. To review the current queue, use Inbox or Workload & capacity.
Read the main metrics
Select a metric to update the timeline and available breakdowns.
In this fictional-data example, the custom period runs from September 11 to 24. All four cards appear in one row, with SLA compliance selected at 75%. Their green indicators compare each result with the preceding period; for Unresolved rate, a decrease is favorable.
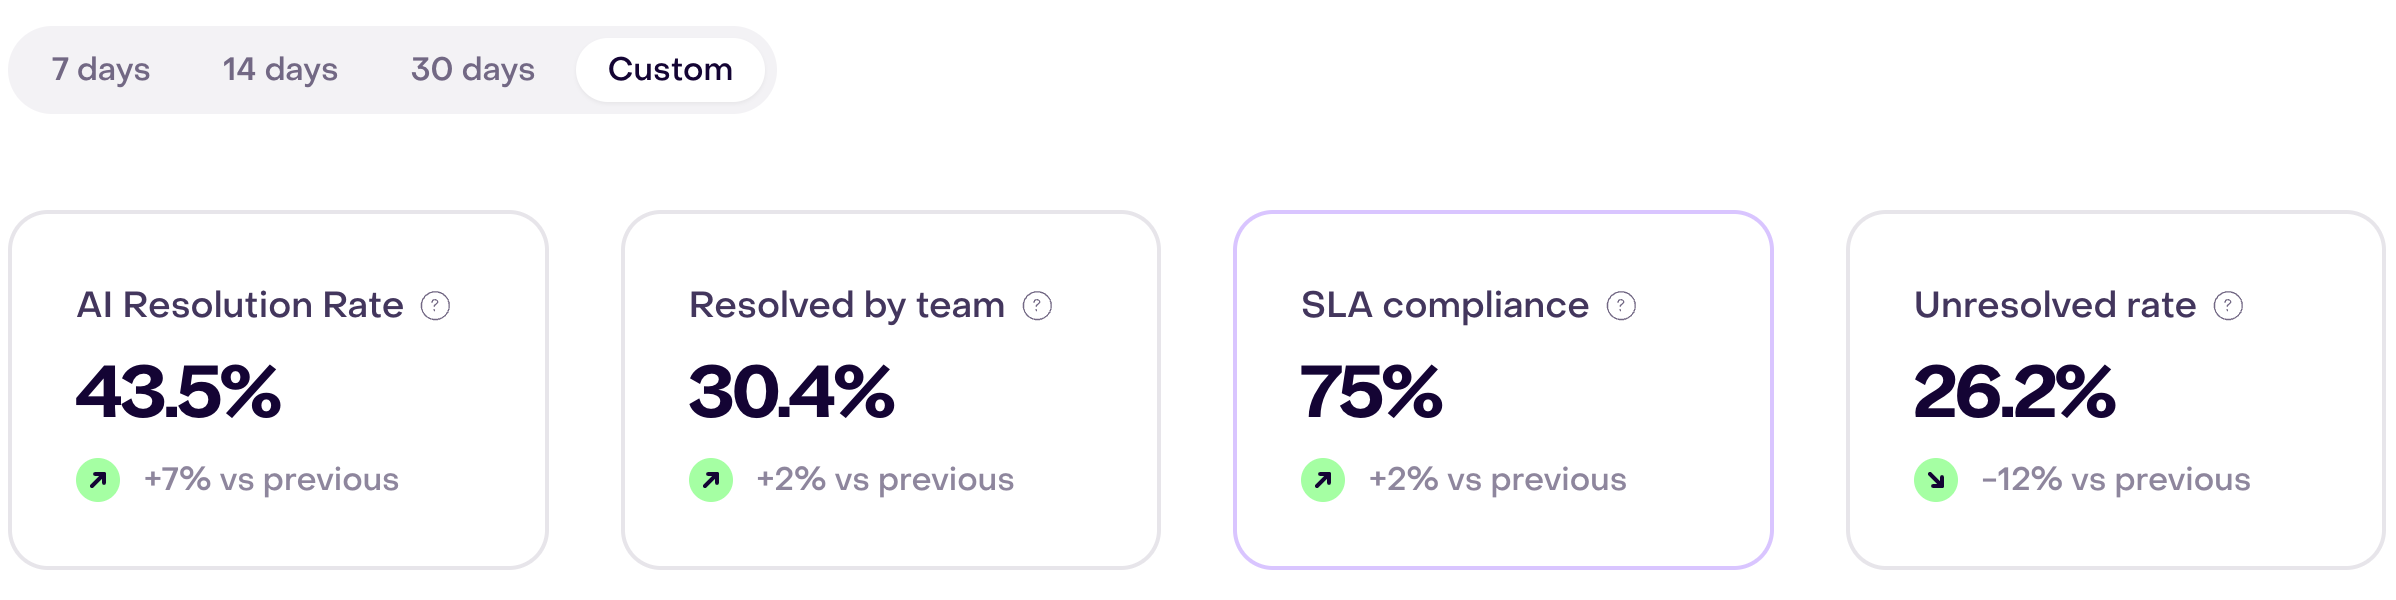
AI Resolution Rate
The percentage of eligible service interactions fully resolved by AI without escalation to a teammate. The denominator also includes interactions that remain open, were escalated, or were resolved by people.
A higher rate means AI completed more eligible conversations on its own. It does not mean AI participated in every other resolution, and it should not be optimized without reviewing whether customers received correct and useful outcomes.
Resolved by team
The percentage of eligible service interactions resolved by teammates, not the number of conversations.
A conversation can include AI activity before the team takes over. When a teammate completes the final resolution, it belongs to the team-resolved result.
SLA compliance
The percentage of first-response or human-handoff obligations that met their configured deadline, among those that ended as met or breached. A breached deadline without an answer counts as breached; active or canceled timers are excluded from this rate.
Hellotext applies the response policy and Business hours that were in effect when each timer started. Internal notes, drafts, Campaigns, and system-only activity do not count as customer-facing responses.
Read Response times and response rules to understand response rules. This report card uses first-response and human-handoff obligations.
Unresolved rate
The percentage of eligible service interactions that remain open or escalated to a person within the selected population.
This metric can decrease as recent conversations close. Use it to find a pattern by channel, team, teammate, AI versus human handling, or resolution path rather than treating every open conversation as a service failure.
Use the breakdowns
Available breakdowns depend on the selected metric:
- AI Resolution Rate: channel, AI agent, or resolution path.
- Resolved by team: team, teammate, channel, or resolution path.
- SLA compliance: team, teammate, channel, AI agent, or AI versus human handling.
- Unresolved rate: channel, team, teammate, AI versus human handling, or resolution path.
Use one dimension at a time when investigating a change. A channel difference can come from customer intent or operating hours; a team difference can come from routing, capacity, or the types of conversations it receives.
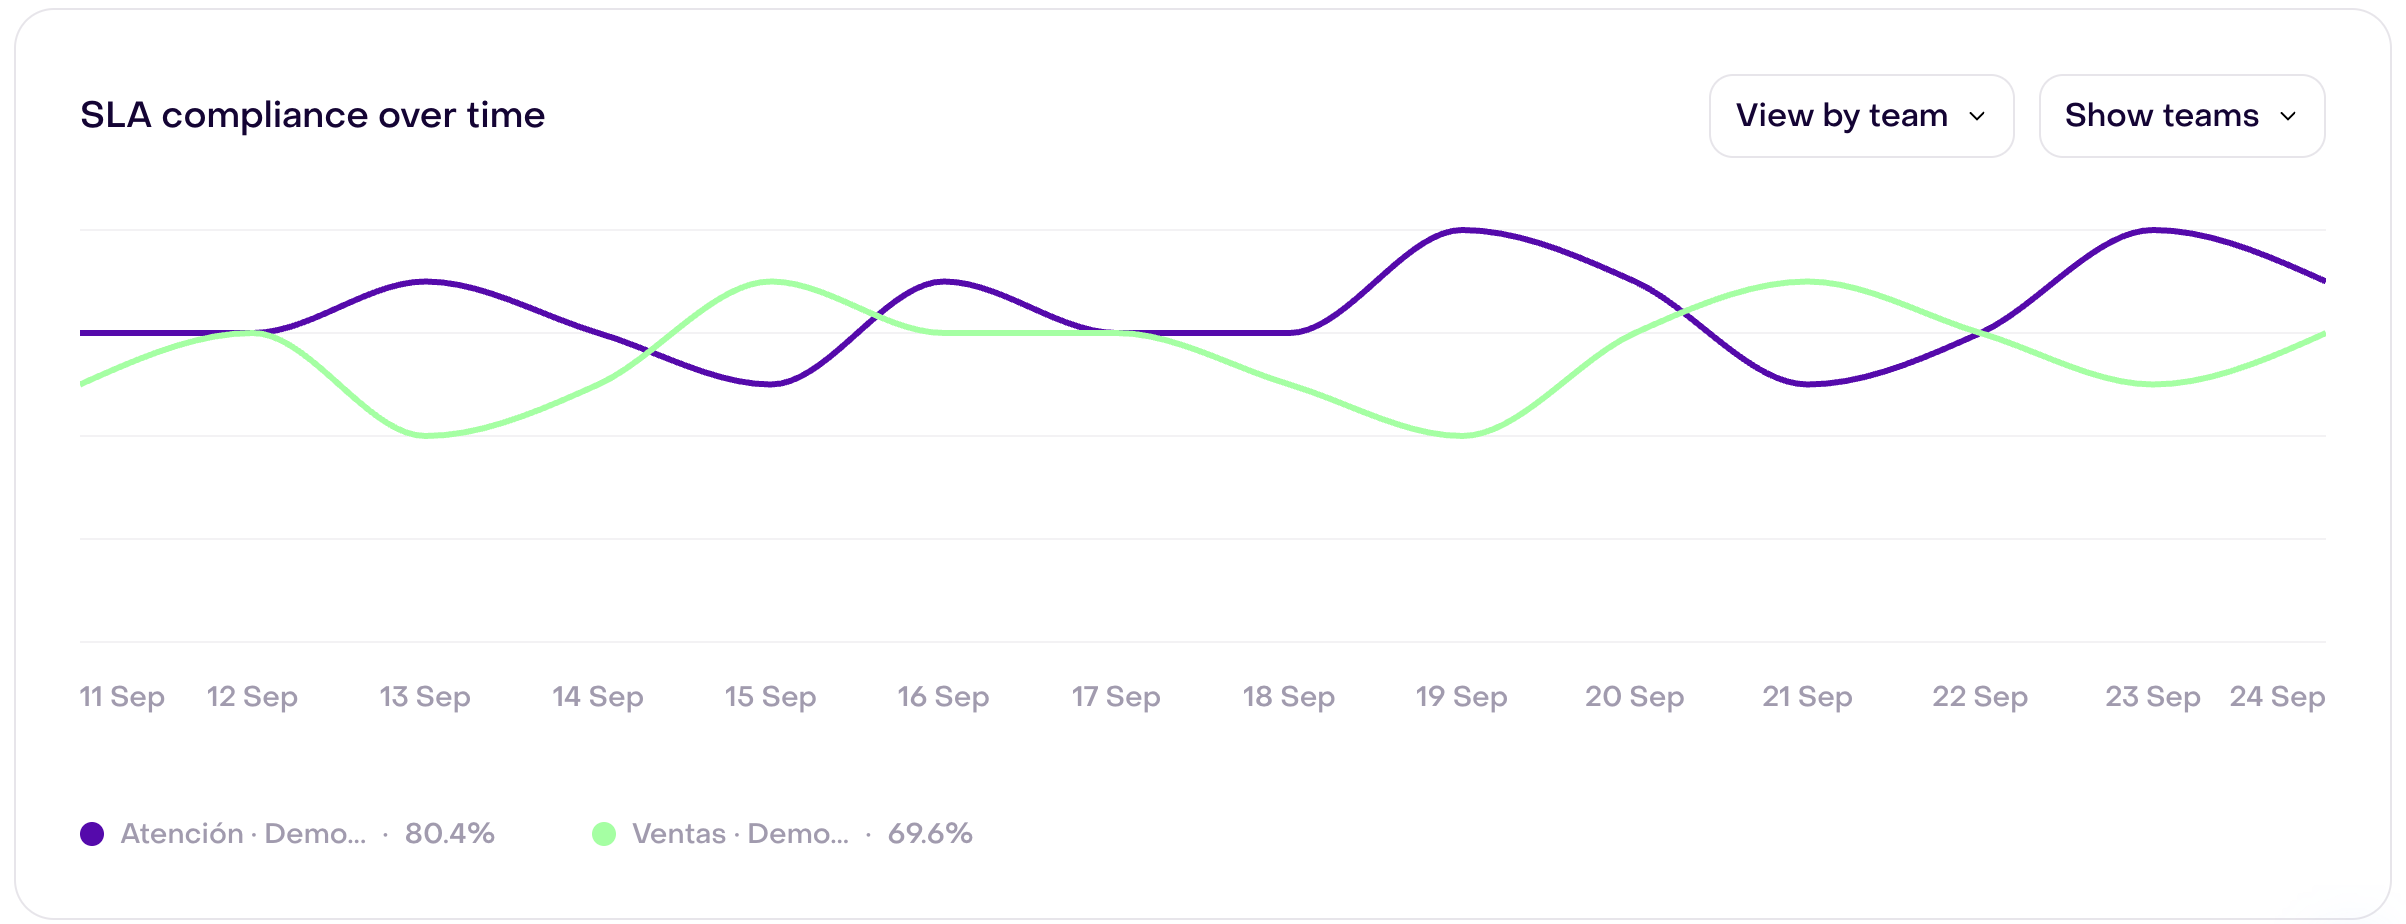
With SLA compliance selected, View by team compares two teams across all 14 days. In this fictional account, the legends summarize 80.4% for Atención and 69.6% for Ventas over the full period; each line shows how its team varied by day.
For Resolved by team, the team bars show each team’s contribution to the selected total in percentage points, not a rate calculated from that team’s own volume.
Understand Resolution path
Resolution path compares only resolved interactions whose final resolution was completed by AI with those completed by the team. Active interactions are excluded from the chart’s shares.
This chart describes the final resolver, not every participant. A conversation that started with AI and was later resolved by a teammate appears as Resolved by team. An AI resolution must complete without escalation to appear as Resolved by AI.
Use the timeline breakdown when you need more detail such as AI only, human from beginning, escalated to human, active AI, or active human.
Understand Customer satisfaction
Customer satisfaction shows the share of positive answers among positive and negative survey answers received in the period. It groups answers by response date and compares the trend with a preceding period of equal length.
You can compare answers from conversations resolved solely by AI with those handled by people from the start or escalated to a person. If a category has no answers, a dash or preview is not an observed satisfaction score.
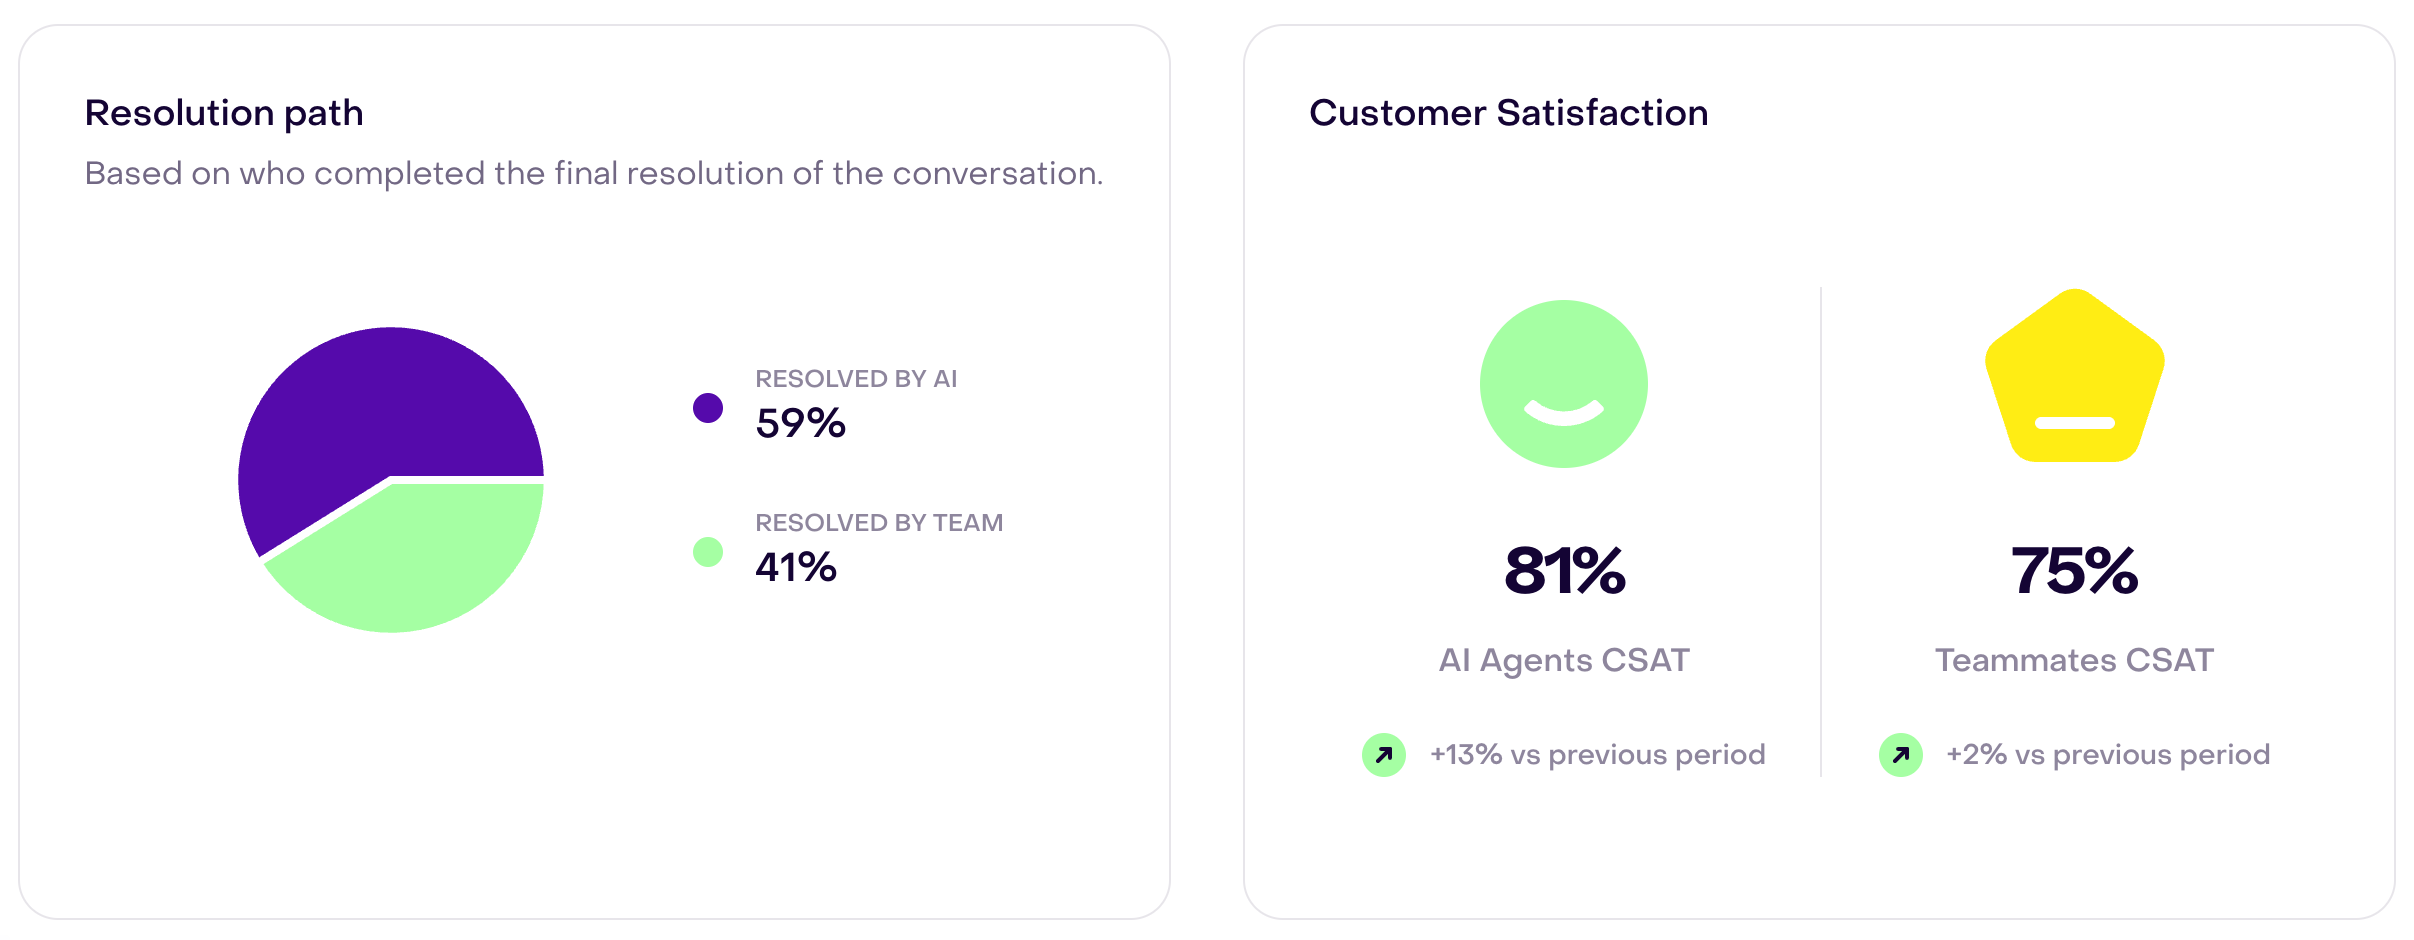
In this fictional account, the left card attributes 59% of final resolutions to AI and 41% to the team. The right card shows 81% CSAT for AI agents and 75% for teammates; both comparisons with the preceding period are favorable (+13% and +2%).
Understand Response time distribution
Response time distribution shows how answered response cycles are distributed across these ranges:
- under 1 minute;
- 1–3 minutes;
- 3–5 minutes;
- 5–10 minutes; and
- 10 minutes or more.
Use the selector to compare all answered first-response obligations, or narrow that sample to AI or human responses. The escalated option shows answers to human handoffs.
In this fictional example, Show all displays the five ranges at 16%, 22%, 20%, 15%, and 27%, respectively. It shows both the quickly answered responses and the waits of 10 minutes or more.
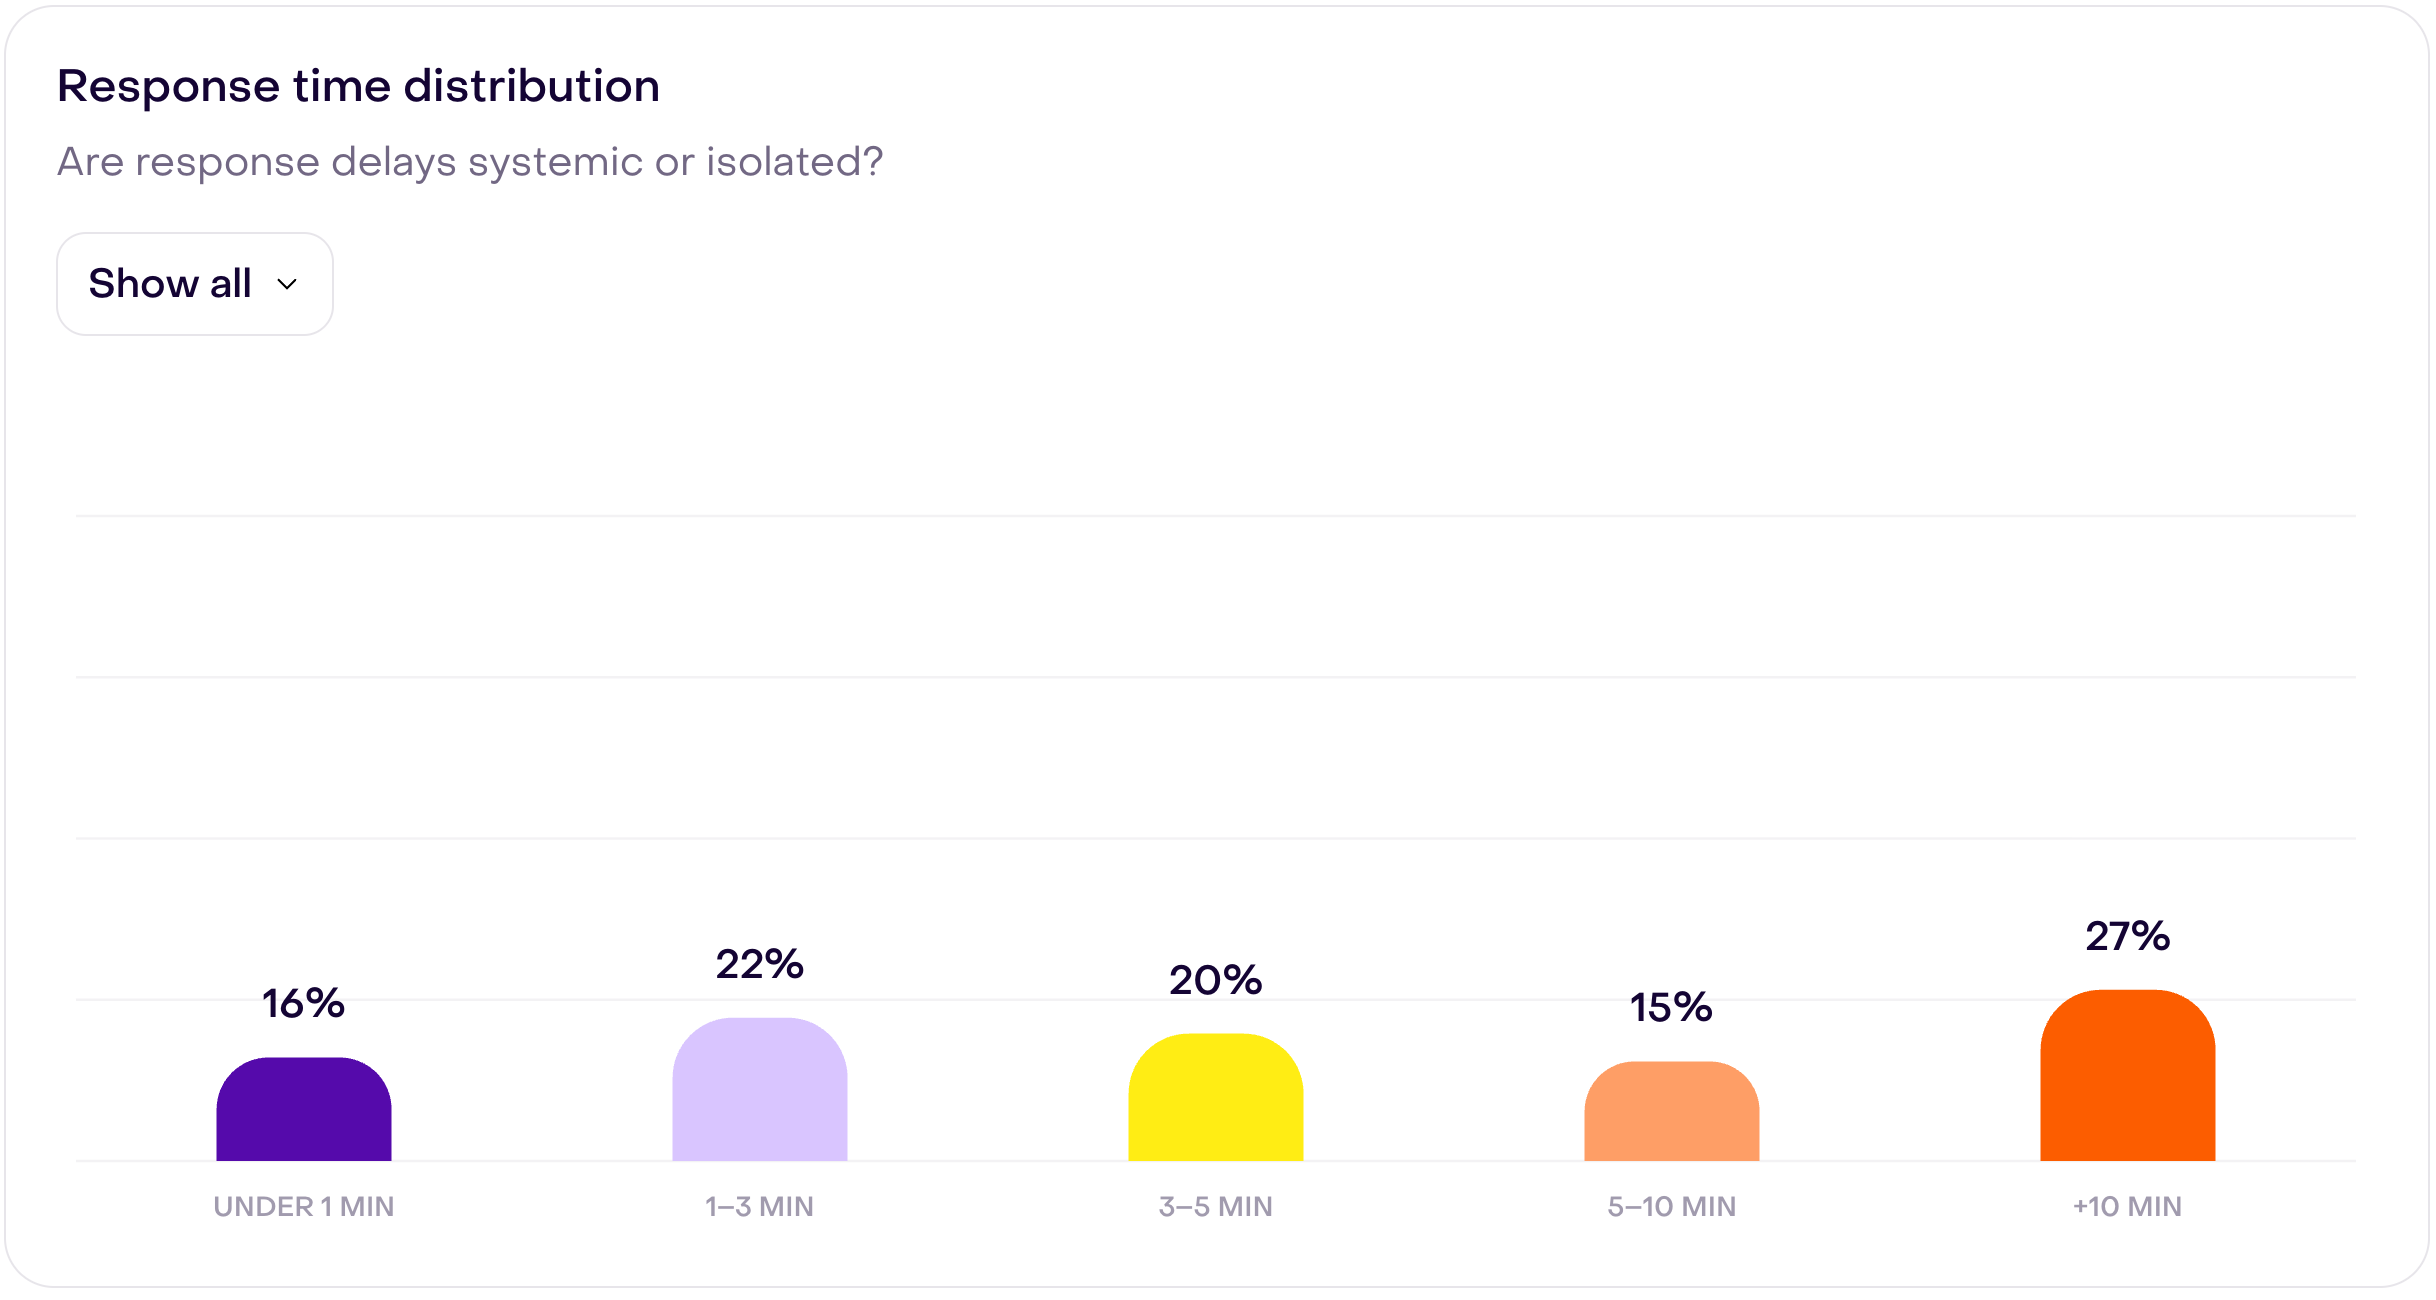
The percentage in each bar is the share of answered responses in the selected option that fell into that range. It is not the SLA compliance rate: that rate also includes obligations that breached without an answer and compares each obligation with its own deadline.
Compare agent performance
The Agent performance table can show all individual agents, teams, AI agents, or teammates.
The All view compares individual teammates with AI agents. Teams are excluded from this view because they aggregate the same human work and would duplicate it.
The columns do not all use the same date: Conversations reflects handling during the period, Resolved uses the resolution date, and response times use cycles started during the period. Eligibility can also differ by role. Do not sum rows to reconstruct the headline rate denominators.
The table can include:
- Conversations: distinct conversations handled by that agent or team during the period.
- Resolved: conversations completed by that row during the period.
- First response: average time for eligible response cycles; team rows can also include answers to human handoffs.
- Average handle: active human handling time divided by handled conversations. AI rows show no value because there is no comparable active-work interval.
- Resolution time: for people and teams, time from the start of ownership to resolution. For AI, the wait from the customer’s final message to the answer from the Playbook that resolved the conversation.
- FCR (First Contact Resolution): percentage of conversations resolved without escalation, reassignment, or a later reopening.
- SLA: percentage of eligible response obligations met among those with a final outcome.
Compare similar roles before drawing conclusions. AI and teammates can receive different intents and have different timing measures. A blank value can mean the measure is unavailable; 0% can also appear when there were no eligible cases. Check the volume before interpreting it.
Turn the report into an action
| If you see… | Review… |
|---|---|
| AI Resolution Rate falling | AI agent, channel, resolution-path breakdown, missing knowledge, unsupported requests, and escalation rules. |
| Resolved by team rate rising | Whether more conversations are being routed to people intentionally or AI is escalating cases it should resolve. |
| SLA compliance falling | Response policies, Business hours, channel differences, team capacity, and unassigned conversations. |
| Unresolved rate rising | Recent open conversations, routing, ownership, capacity, and repeated issue types. |
| Many waits reach 10 minutes or more | Whether the delay is concentrated in human-handled, escalated, channel, team, or teammate activity. |
| Low FCR for one row | Escalations, reassignments, reopened conversations, and whether ownership is reaching the correct destination. |
Open representative conversations before changing a Playbook, routing rule, response policy, or team capacity. The report identifies a pattern; the conversation history explains what happened.
For example, if SLA compliance falls, select that metric, compare one channel or team, and use Response time distribution to see where answered waits cluster. Then review representative conversations, including obligations that breached without an answer: the wait bars alone do not show the SLA rate.
When data is missing or unexpected
Confirm that:
- conversations have a recorded start, owner, and lifecycle outcome;
- AI resolutions and escalations were recorded by the Playbook or route;
- teammates closed completed conversations instead of leaving them open;
- response rules and Business hours are configured for the channels you are comparing;
- surveys have positive or negative answers with recorded answer dates if you are investigating customer satisfaction;
- team and teammate assignments identify who handled the conversation; and
- both comparisons use the same date range, timezone, metric, and breakdown.
If the source records exist but the report remains inconsistent, follow Data completeness and reporting gaps.